 Local artists Ross Dalziel and Jackie Passmore have been working with a group of local "young adults" to experiment with the intersection of gardening and technology. Every Thursday over the summer they've been running workshops at FACT (the Foundation for Art and Creative Technology) and have planted out some pots and raised beds on the roof terrace.
The technology side of the project has included some time-lapse photography of the plants growing and building crazy vegetable and potato synthesizers with some of the produce grown. Ross thought it would be cool to do some environmental monitoring and publish some data to the Internet and so asked us to get involved.
Basic Monitoring
It was an obvious application for an Arduino and a Pachube account. On the first workshop day we ran through getting up and running with Arduino, and the attendees split into three groups to build a monitoring circuit and write some code. One team measured temperature; another the ambient light level; and the third used galvanised nails to monitor the moisture level of the soil. We then merged the sketches together to run on a single Arduino with an Ethernet shield, which uploaded the results to Pachube.
We ran out of time to get the kit installed in the garden on the first day, so running cables and positioning the sensors was done during the second workshop. Once we'd found a live network port in the FACT office, we were up and broadcasting sensor data to the world.
Here are some graphs of the live data coming from the sensors. They're showing the past four days of data, and if you want to explore it in more detail then you can see more at the FACT Garduino Pachube page.


Air Quality
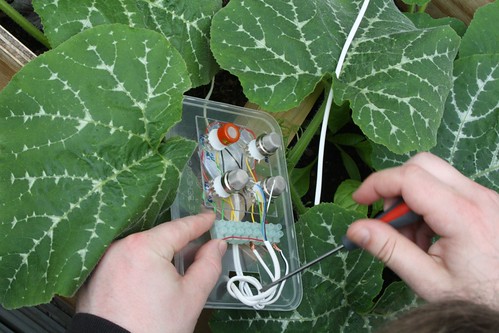
For a while now we've wanted to do some air-quality monitoring, and this project gave us the perfect excuse. There wasn't enough time in the workshops to build the system from scratch, so the main circuit and software was developed in the MCQN office and the final soldering and boxing up was done during the second workshop day.
You can see the main sensor board in the photo above. There are four sensors, each measuring the level of a different gas - carbon monoxide, ozone, liquid-petroleum gas and generic "air quality". We weren't expecting there to be much LPG present up on the roof, but that sensor is also sensitive to cigarette smoke.
Once again, here is the last four-days of data, and there's more at the FACT Airduino Pachube page.


And if you'd like to know a bit more about the over-arching project, then take a look at the project blog.